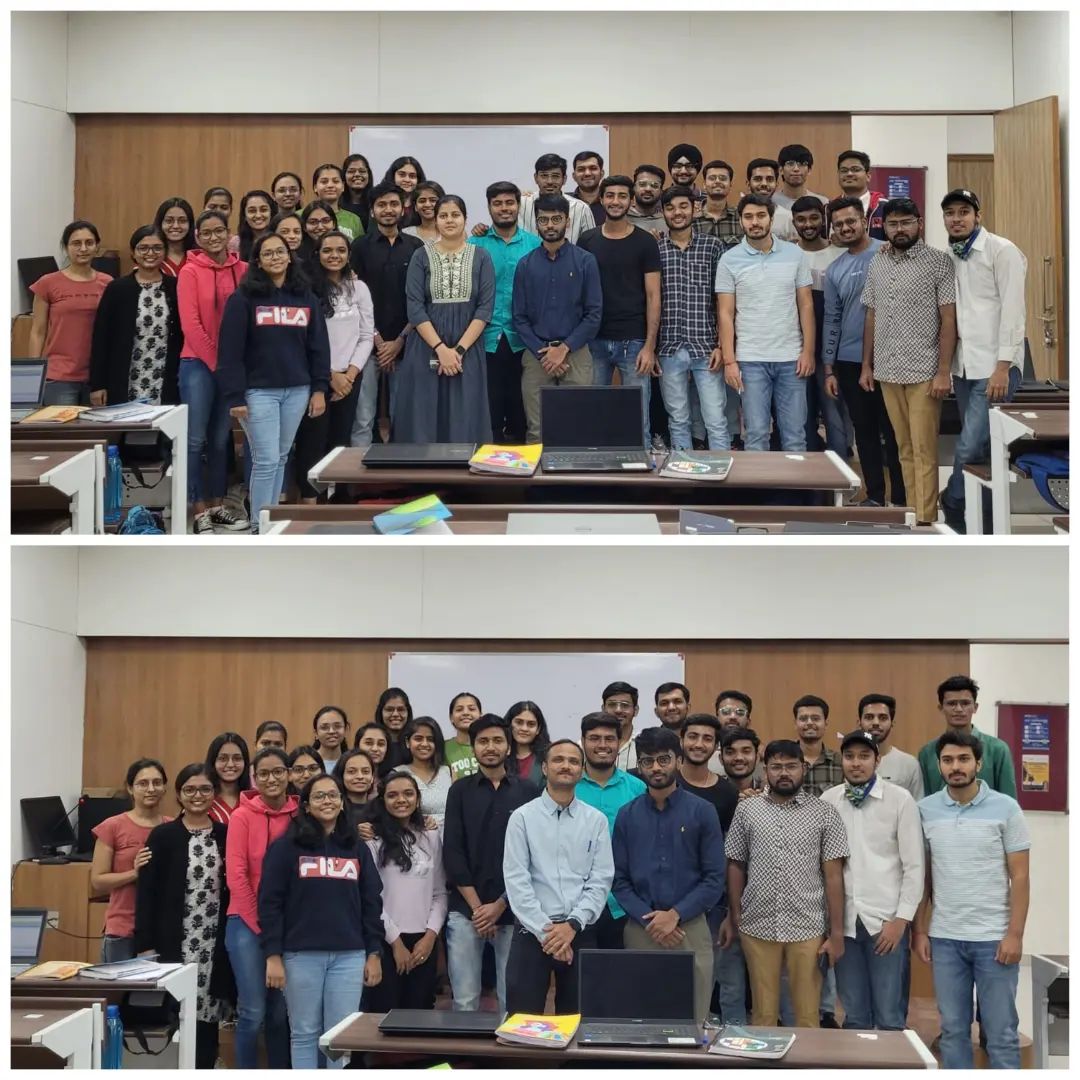
National Level Seminar on Data Visualization using Power BI Image Gallery
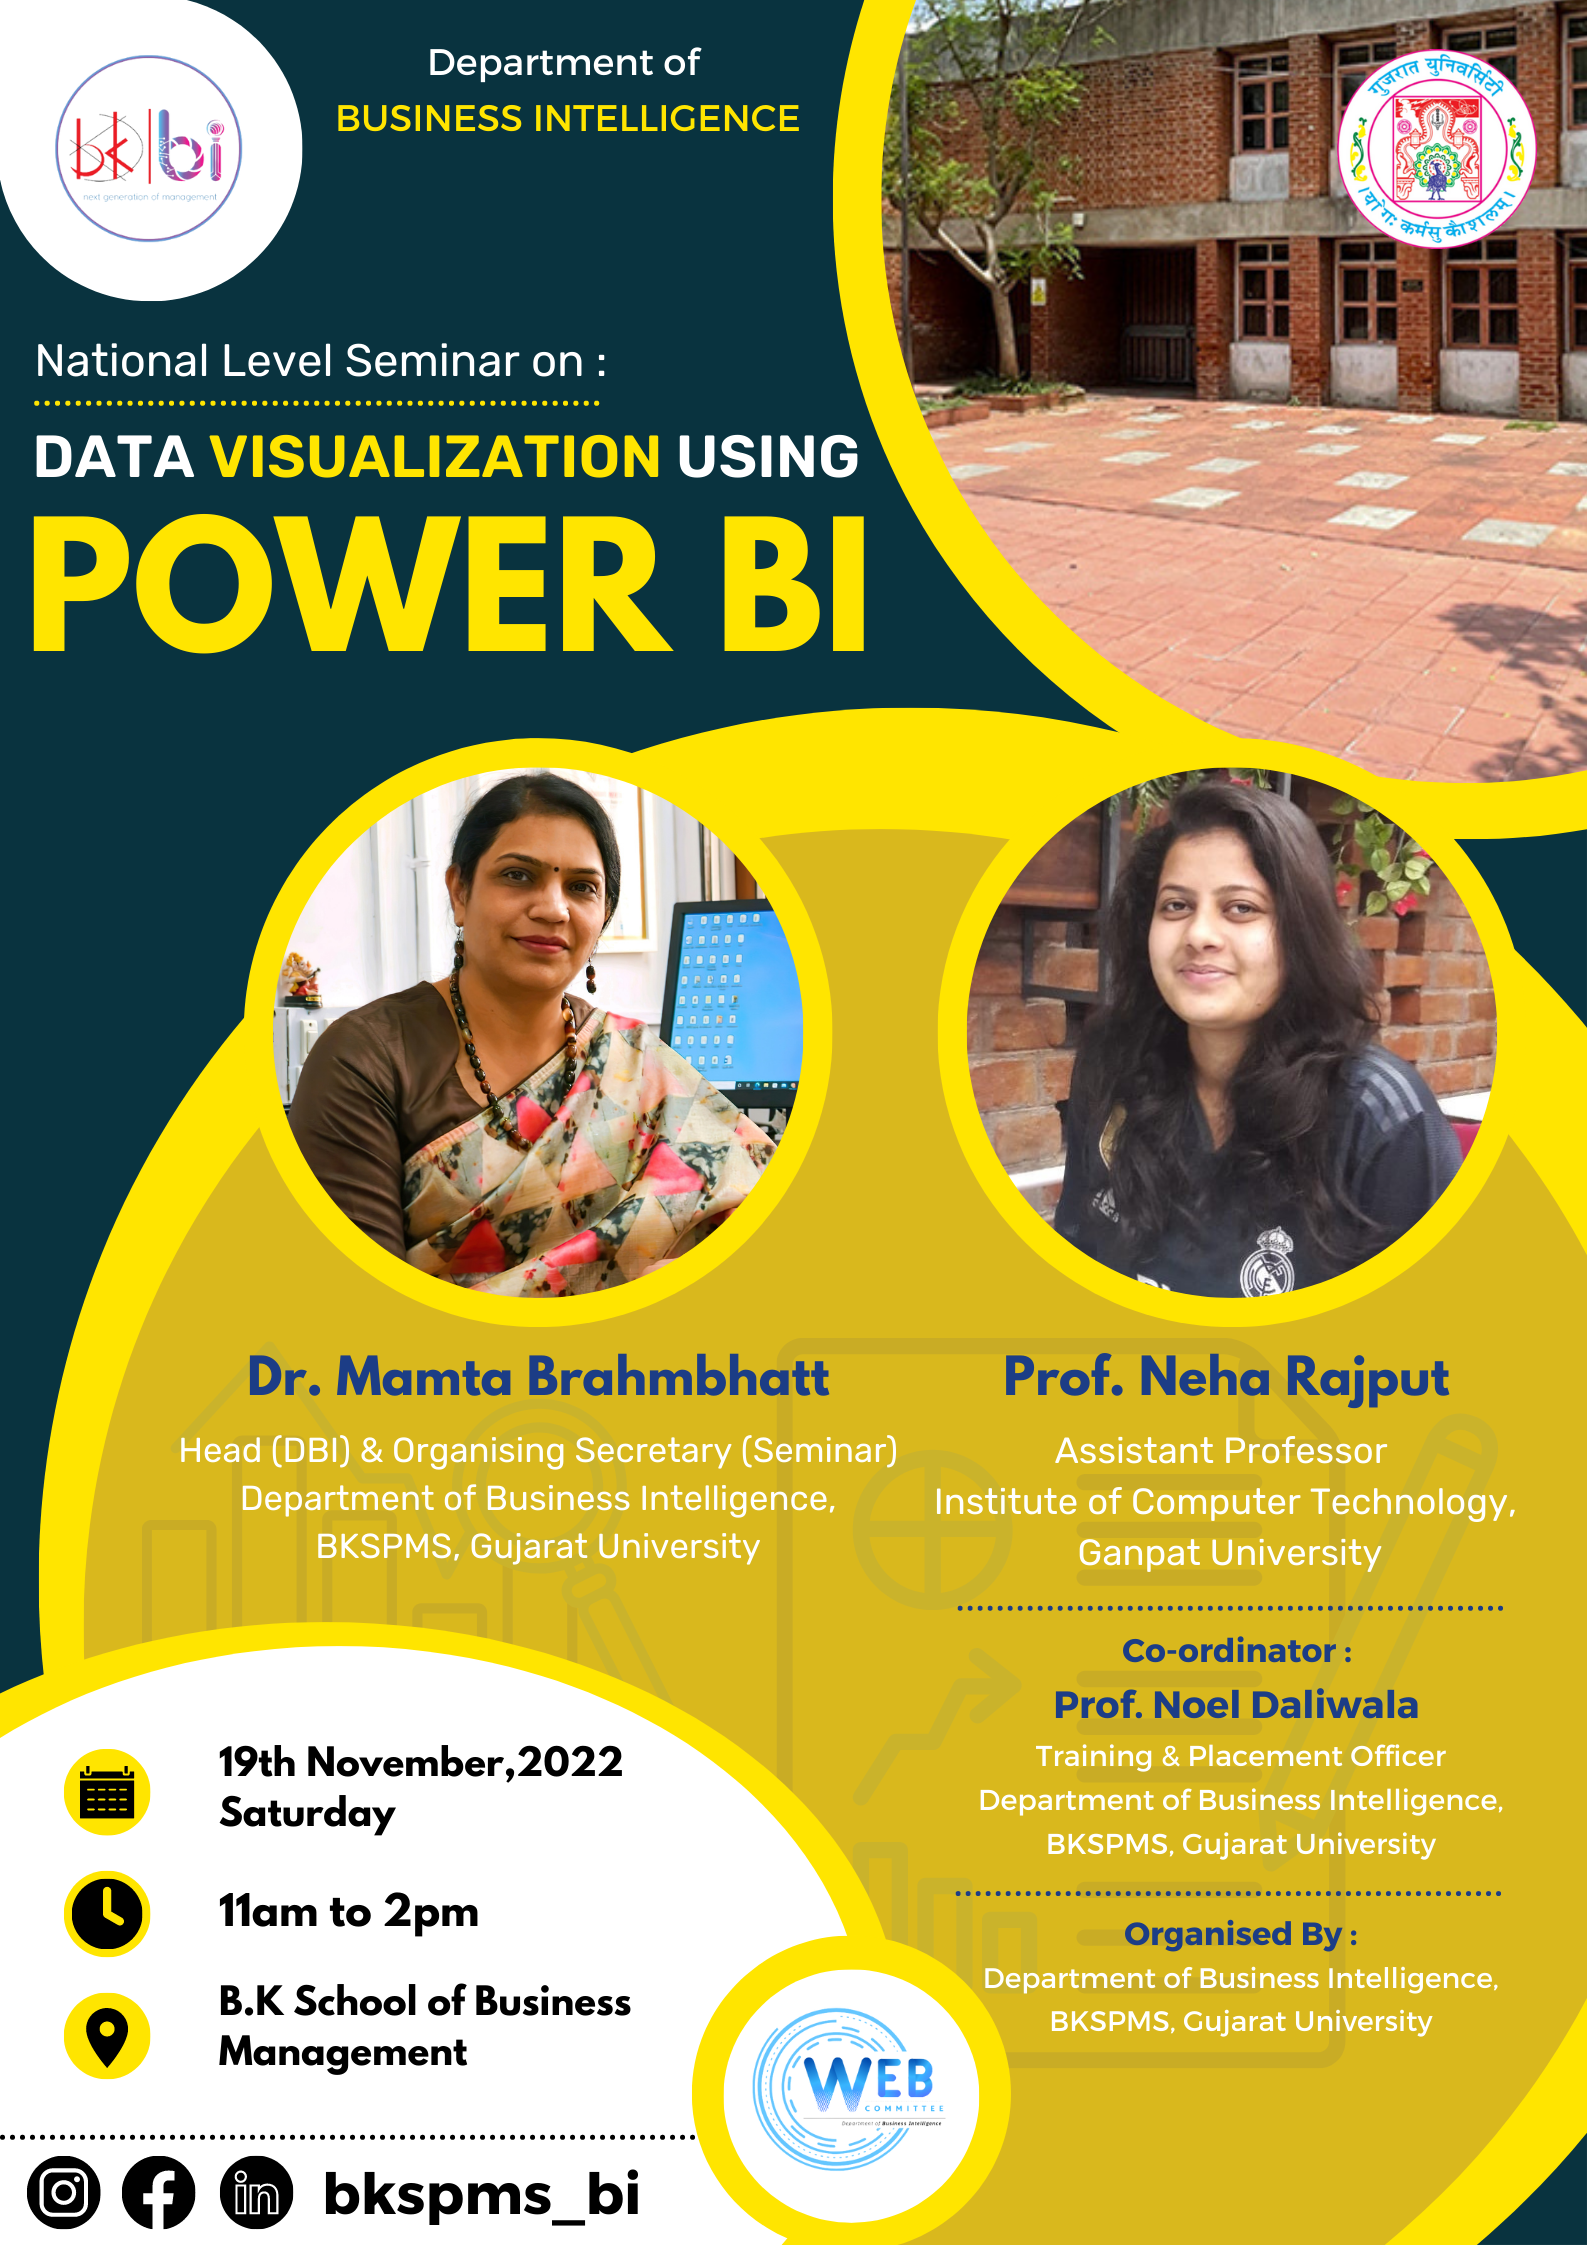
The National Level Seminar on "Data Visualization Using Power BI" organized by our department was a captivating journey into the world of turning complex data into insightful visuals. We started by unravelling the basics and then delved into how Power BI can transform raw data into compelling stories. Distinguished speaker Ms. Neha Rajput shared practical tips on creating interactive dashboards, visualizing trends, and making data-driven decisions using Power BI. Through this hands-on session, students got the chance to bring their data to life, learning how to craft visually appealing and informative reports. The seminar highlighted the power of visual storytelling and the role of Power BI in simplifying the process. The success of the seminar can be attributed to its well-structured content, engaging presentations, and the practical skills participants acquired. Attendees left with not only a deeper understanding of data visualization but also with the ability to harness Power BI for effective storytelling through data. In summary, the National Level Seminar on "Data Visualization Using Power BI" wasn't just about graphs and charts; it was a visual expedition, empowering participants to transform data into compelling narratives using the dynamic capabilities of Power BI.